demomentum header image


Jobs graph, motor vehicles sector, Manufacturing employment 1950-2018, and Unemployment Rate, 
                                     2006-2018 (Preview image)


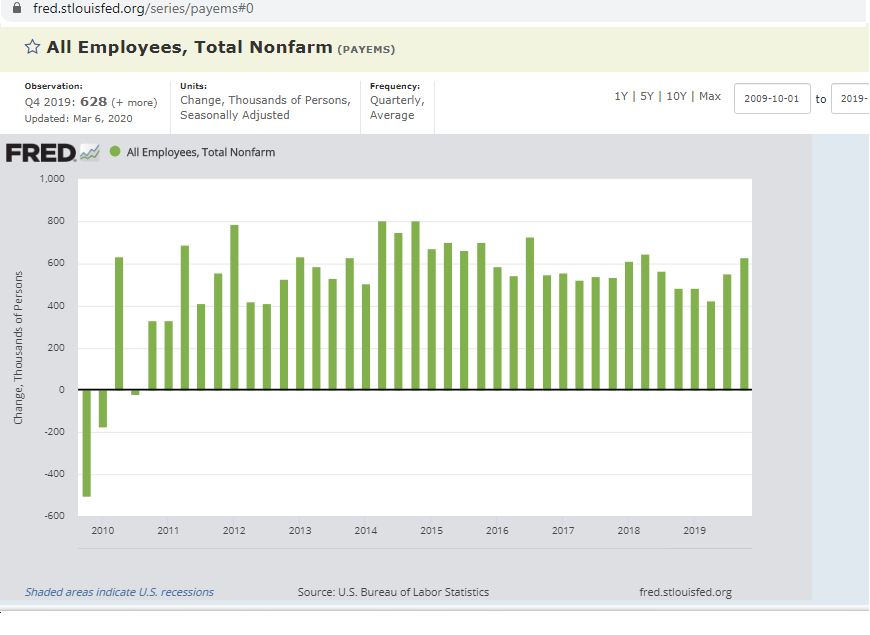
See below, a visual view of the economy's expansion when the Democrats held the White House.

            Tracks the recovery from the last recession and financial crisis of '07-'09.

                              ... And since ...


Covering unemployment and Jobs ...

and GDP ...


Manufacturing Jobs - the 2010 Rebound


            MANUFACTURING EMPLOYMENT took a sharp climb upward — in 2010.

-- The turnaround in these jobs since 2010 (BLUE arrow - see below)
were the 1st gains since the 1990s.

Factory jobs peaked previously in 1979, at 19 million jobs.


Manufacturing  employment
 (1000s of persons), seasonally adjusted


[Note, you can produce the chart, from the Federal Reserve Bank website here.
Then, can select or enter a start period, such as 1955-01-01,
can select "edit graph" and "Format" to control the width on the page, e.g.,
"800" pixels wide, or "700" pixels and click "Apply".
That will produce the chart above.]


Unemployment plunged ...


Here is the trajectory, over a decade, of UNEMPLOYMENT shrinking

as shown at the end of each year, and through year-end 2019

Year-end monthly unemployment rate (December) through Dec. 2019

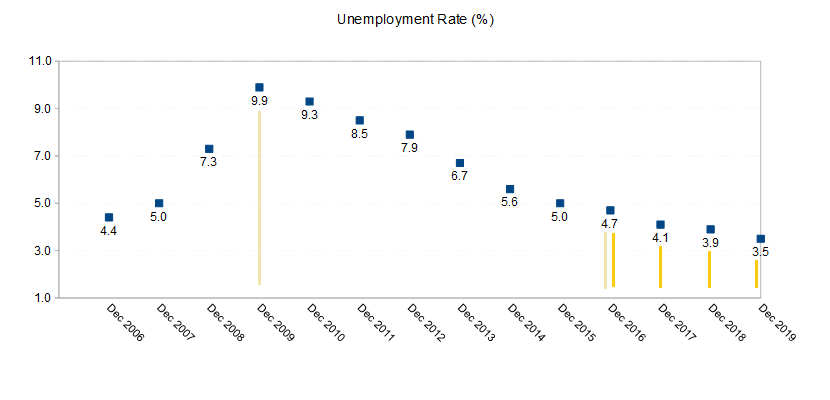
                                Source data: Bureau of Labor Statistics, from monthly data seasonally adjusted


Since the end of 2009, unemployment
has shrunk each year, from about 10% of the workforce down to
4.7% when President Obama finished his term.

Since Trump took office the unemployment rate has
fallen from 4.7% to 3.5%


For Black/ African-American workers, here's the direction in the UNEMPLOYMENT RATE, shown through year-end 2019:

African-American unemployment rate, Year-end monthly (December) through Dec. 2019

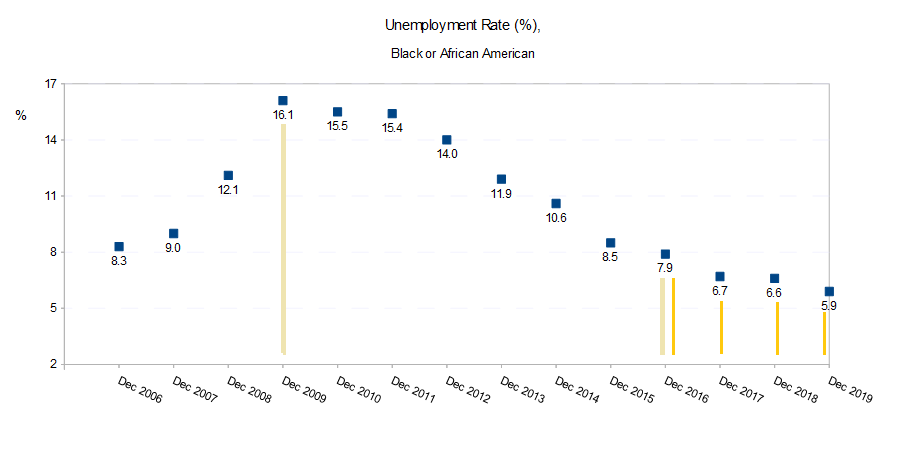
                                Source data: Bureau of Labor Statistics, from monthly data seasonally adjusted


Most recent report for February 2020:     5.8% for the Black/ African-American unemployment rate


Job growth, as shown below, averaged over quarters (from the monthly reported figures),

has been no speedier during the last 3 years than in the years preceding.


Change in non-farm payrolls, thousands of persons, seasonally adjusted, QUARTERLY


Here's a display of ANNUAL average job growth (in thousands [000]), since 2010 - from the Federal Reserve Bank of St. Louis website ("FRED" website), taken from BLS data:


Annual job growth, since 2010


The numbers for each of the last six years > >
              Millions of new jobs:


        2014         2.567 M;
        2015         2.882 M;
        2016         2.525 M;


      2017         2.260 M;
      2018         2.302 M;
      2019         2.045 M


The average gain in jobs in the prior 3 years (2,567,000 in 2014 and  2,882,000 in 2015 and 2,525,000 in 2016)

were larger than gains

of the last 3 years ( 2,045,000 last year in 2019, 2,302,000 in 2018, and 2,260,000 the year before, in 2017).


Note the rebound, then plateau, in motor vehicle sales and employment.

VEHICLE SALES (Autos and Light Trucks), and AUTOMOBILE FACTORY EMPLOYMENT


Vehicle sales, autos and light trucks, 1996-2018, annual. Millions of units


Semi-annual Vehicle Sales
 (through the 2nd half of 2019)


Vehicle sales, autos and light trucks, Semi-annual, 1996 to 2nd half of 2019. Millions of unit, at Annual Rate (seas. adjusted)


Automobile Factory JOBS


Employment, motor vehicle manufacturing (thousands of persons). Monthly, Jan 1995 to December 2019, seasonally adjusted data

GDP


Also, see the much bally-hoo'ed GDP [gross domestic product] — it grew last year 2.3% in 2019, from 2018.


Real GDP Growth, 2010-2019


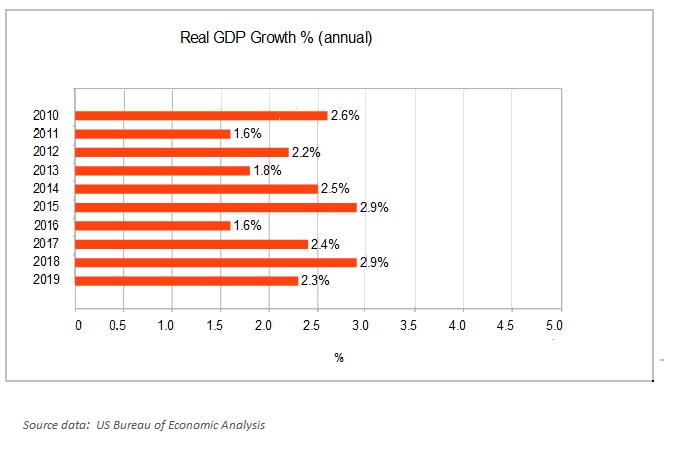
The annual growth rate is shown above.    Even the previous year's economic growth, in 2018, was the fastest since, well, ... 2015.

Quarter-over-quarter growth is shown below.

Real GDP Growth, Quarterly


Looking at the employment and GDP growth data, how do you assign credit where credit is due?

Can perhaps credit lawmakers who turned around the 2007-2009 financial crisis and recession by voting to approve
the American Recovery and Reinvestment Act of 2009 (ARRA) when the financial and housing markets were deteriorating.
It passed in the Senate 61-37, with 56 Democratic senators (+ 2 Independents) and only 3 Republican senators voting to approve.
In the House, 244 Democrats and 0 Republicans, voted to approve.

Final passage was early in the Congressional session, February 2009, and President Obama signed it in February.

  – Credit Congress, your Senators and your Representatives, for voting it through, CREDIT PRES. OBAMA for pushing it through (call the last 9-10 years of recovery Obama-mentum).

  – Credit Obama and his vice-president, Joe (call it Joe-mentum).


  – Credit leadership of all of them, you can call it   Demomentum, too.


Finally, looking at either the annual growth in GDP, or the recent quarterly numbers,
as shown in charts above, it's clear that the revved up
5%, or 4% or even 3+% accelerated rate that the 45th President promised for sustained growth has not come to pass.
And that's even in the aftermath of the much-touted tax bill of 2017.


It looks like a born-on 3rd base economy.


        Or, who in the White House do you think may believe he's hit a home run?